A limited-time invitation to the Everything plan Offer ends December 7, 2026 · 11:59 p.m. New York timeLoading countdown…
SentimenTrader · Analysis over emotionGet answers to your market questions ↗

Sentiment Research
Since 2001.
Now available intraday.

Monitor individual S&P 1500 stocks with Intraday Sentiment Score ↓, updated every five minutes on your dashboard. Intraday Minutes emails notify you when an extreme sentiment signal warrants your attention.

More beyond Intraday Sentiment.

Looking for trading ideas backed by research? ↓Need reliable data for your own analysis? ↓Want our data feed directly in your trading tools or AI assistant? ↓

THE EVERYTHING PLAN

Standard price: $99 per month

Start with 7 days free.

$33per month for your first
3 paid months

A low-risk way to evaluate SentimenTrader and put our research, data and tools to work in your trading or investing routine. Cancel anytime.

Credit card required. After your trial, pay $33 per month for the first 3 paid months, then $99 per month. Billed automatically unless cancelled. No three-month commitment.

Cancel before your 7-day trial ends and you won’t be charged.

See offer details
New paying customers only · Ends Dec 7

YOUR QUESTION. YOUR STARTING POINT.

How can SentimenTrader help me
make my next trading decision?

UNDERSTAND THE MARKETRESEARCH REPORTS
Data as of November 2, 2026
A RESEARCH EXAMPLE

“Similar patterns point to a choppy stretch ahead”

Published November 3, 2026 · SentimenTrader

Look beyond the index.
Understand what’s happening beneath the surface.

When the market pulls back, it’s difficult to know whether weakness is limited to a few stocks or spreading across the broader market.

SentimenTrader combines market breadth, sentiment indicators and historical research to help you understand conditions, evaluate risks and identify opportunities.

WHAT DOES THE EVIDENCE SHOW?

69% of Nasdaq 100 stocks were at least 10% below their 52-week highs, compared with 55% of S&P 500 stocks. Weakness was more widespread among Nasdaq 100 stocks.

Actual breadth chart · November 2, 2026

Historical perspective

A separate study identified 17 historical matches to the Nasdaq 100’s 65-trading-day price pattern through November 2. Of those, 16 were higher one year later, although some experienced substantial further declines along the way.

What does this mean for investors?

Nasdaq 100 stocks showed more widespread weakness, while similar historical price patterns often preceded gains over the following year. Those recoveries could still involve deep declines. Your investment horizon, and how much further downside you can tolerate, matter when evaluating a pullback.

Historical outcomes do not predict or guarantee future results. Breadth data and price-pattern analysis are as of November 2, 2026.

Actual historical pattern comparison · Match date November 2, 2026
CONTINUE WITH THE SPECIFIC REPORT

Similar patterns point to a choppy stretch ahead

Published November 3, 2026. Read the report on SentimenTrader and start your trial there to access the full research.
Read the full report ↗
FIND OPPORTUNITIESSMART STOCK SCANNER
Filtered scanner example · November 4, 2026

Find stocks worth investigating.

When markets turn volatile, knowing which stocks deserve your attention can be challenging. SentimenTrader’s Smart Stock Scanner helps you narrow your search instead of reviewing hundreds of charts.

Scan 1,500+ stocks and ETFs daily across predefined signals. Filter by trend strength, historical performance and risk to build a focused research shortlist.

A CONCRETE STARTING POINT

With the filters shown, the November 4 scan returned four long candidates: AAPL, BEN, CI and ZBRA.

Dated research example, not live trading recommendations. Signal direction and historical results do not guarantee an outcome.

Actual filtered Smart Stock Scanner results · November 4, 2026
Another way to find opportunities: My Screen

Keep an eye on opportunities as conditions change.

During pullbacks, look beyond short-term weakness to find stocks whose longer-term trends remain intact.

The ready-made Long Ideas Screen identifies S&P 500 stocks above their 200-day moving average while their 5-day Optix average is below 35. These may be pullbacks within longer-term uptrends that deserve further research.

Save your own screens and enable email alerts to receive matching results before the next trading day opens.

Actual Long Ideas Screen example · November 4, 2026
TWO WAYS TO FIND OPPORTUNITIES

See how each tool helps narrow your search.

Review four selected Smart Stock Scanner candidates, or see a sample My Screen shortlist. These are fixed examples; sign up to access the tools and current results.

See the four-stock example ↗See the My Screen example ↗
FOLLOW A PLANSWING TRADING STRATEGIES
Std-Dev Rounding-Bottom Strategy

Know what to look for,
when to act, and when to step aside.

Finding a stock to buy is only half the challenge. Knowing when to enter, take profits and cut losses can be just as difficult.

SentimenTrader offers 10 systematic swing trading strategies with predefined rules and buy and sell signals, helping you follow a plan instead of reacting to every move.

SEE A PLAN IN PRACTICE

The Std-Dev Rounding-Bottom Strategy uses clearly defined trading rules. It looks for stocks forming potential bottoms and waits for momentum confirmation before generating trade signals.

You decide whether to act and place any trades yourself. Strategy signals do not execute trades automatically.

Actual strategy actions for the November 5, 2026 market open · Dated example

Know what to do next

Review the strategy’s buy and sell actions before the market opens. Buy setups show entry prices, profit targets, stop losses and maximum holding periods. Sell actions show position performance and the reason for exiting.

See how it has performed

From January 3, 2023 through November 4, 2026, the strategy’s paper-traded cumulative return was +195.27%, compared with +101.36% for SPY buy-and-hold.

Strategy results are based on paper trading and do not represent actual live trading. Past performance does not guarantee future results.

Actual strategy dashboard and benchmark comparison · Through November 4, 2026
A PLAN YOU CAN FOLLOW

Less second-guessing. Clearly defined trading rules.

Our 10 swing trading strategies provide buy and sell signals with defined entry prices, profit targets, stop losses and holding periods, so you don’t have to work out every move from scratch. See the Std-Dev Rounding-Bottom Strategy as an example.

See the strategy example ↗

EVERYTHING PLAN · LIMITED-TIME OFFER

Make SentimenTrader part
of your trading process.

Address the market concern that brought you here. With support from our team, use the next three months to put our research and tools to work in your trading or investing routine.

Standard price: $99 per month

7 days free.
Then $33 per month for your first 3 paid months.

Credit card required. After the trial, pay $33 per month for the first 3 paid months, then $99 per month. Billed automatically unless cancelled. Cancel anytime. Available to customers who have never paid.

THE DATA BEHIND YOUR ANALYSIS

Your analysis.
Powered by SentimenTrader data.

Build and test your own market views with 20,000+ indicator series covering stocks, ETFs, indexes and selected cryptocurrencies. Explore sentiment, trend, volatility, market breadth, seasonality and macro data.

Compare Smart Money and Dumb Money Confidence to see whether these investor groups agree on the market’s direction or are moving apart. Differences in their confidence can provide context for assessing your own market view.

Smart Money / Dumb Money Confidence · Actual chart, November 4, 2026
EXPLORE THE INDICATORSSmart Money / Dumb Money Confidence ↗Put/Call Ratios ↗AAII Bull Ratio ↗Short-term Optimism Index ↗

An index can rise even when many of its stocks are falling. Market breadth indicators help you see how widely gains and losses are shared across stocks, giving you more context for assessing the strength of an index’s move.

McClellan Oscillator · Actual chart, November 4, 2026
EXPLORE THE INDICATORSMcClellan Oscillator ↗Advance/Decline ↗% Above Moving Averages ↗New Highs/Lows ↗

Assess conditions across the broader stock market through measures of volatility, investor panic and euphoria, and credit stress. Use these indicators together to identify signs of increasing stress or excessive confidence when evaluating how much risk to take.

Panic / Euphoria Model · Actual chart, October 30, 2026
EXPLORE THE INDICATORSVIX Term Structure ↗Panic/Euphoria Model ↗Short-Term Risk Levels ↗CDX ↗

AN INDIVIDUAL STOCK EXAMPLE · NVDA

One stock. Three useful perspectives.

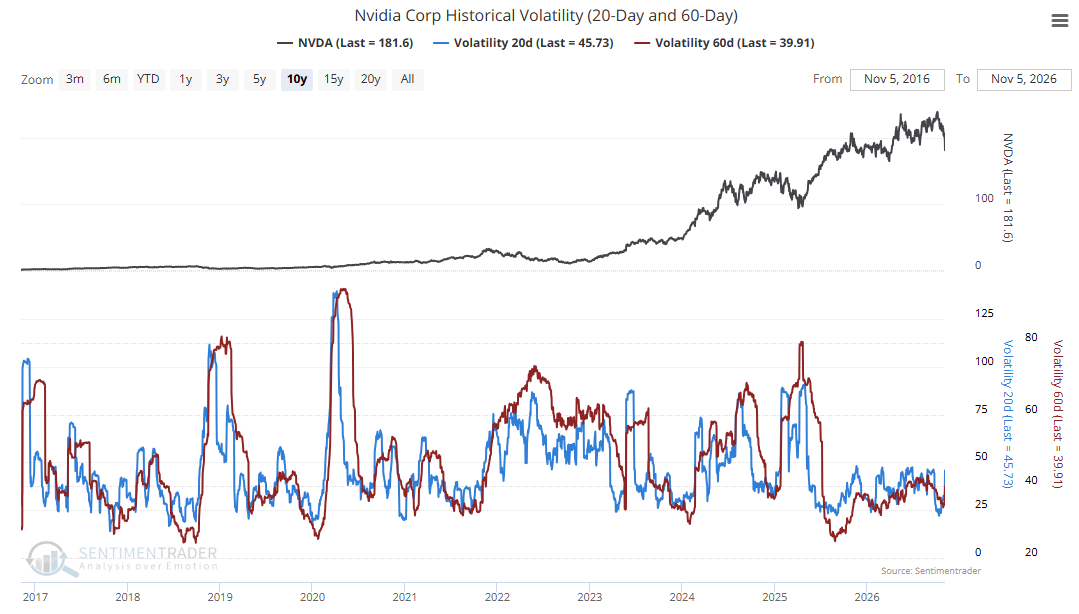
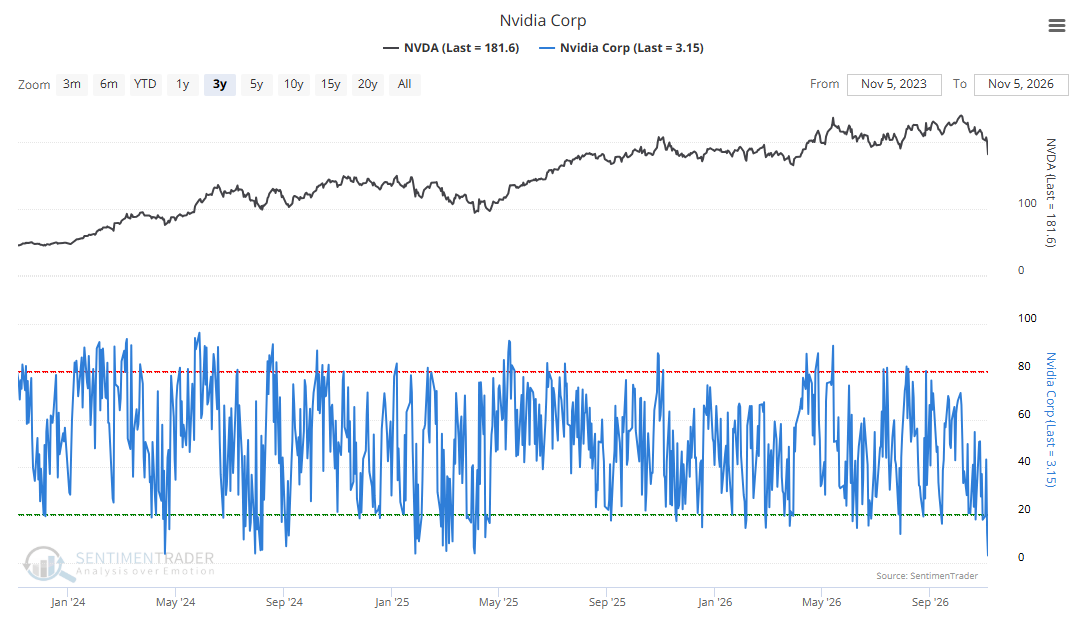
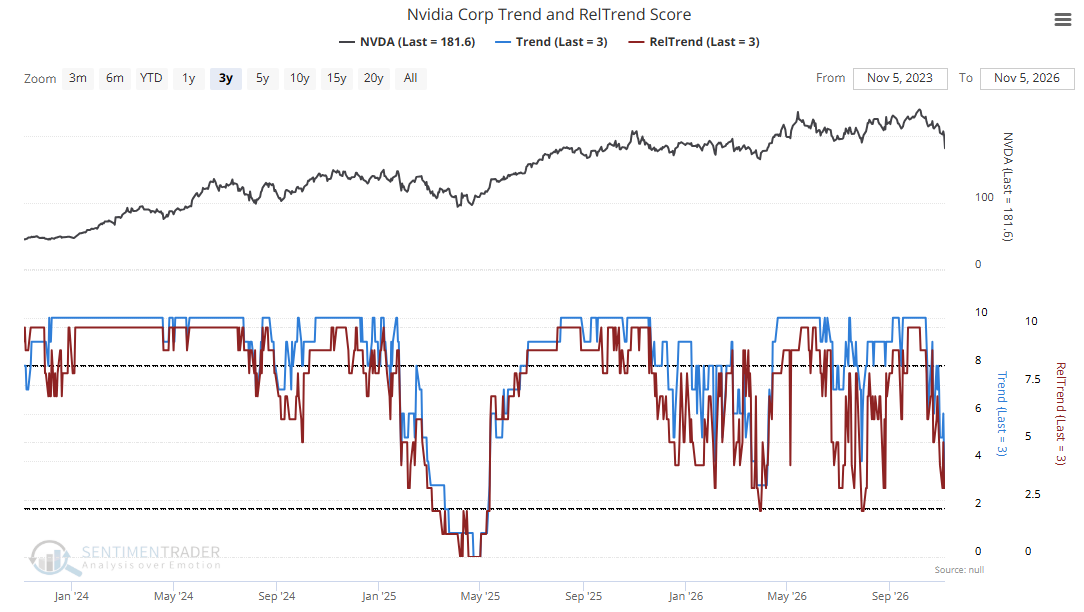
Combine sentiment, trend strength and historical volatility to build a more complete picture of a stock you follow. Here’s how those three measures work together for NVDA.

Optix Sentiment

See whether optimism around NVDA is unusually high or sentiment has cooled.

Historical NVDA Optix Sentiment chart from the Light Data API exampleView NVDA sentiment ↗

Trend Score

Check the strength of NVDA’s trend and whether it is strengthening or fading.

Historical NVDA Trend Score chart from the Light Data API exampleView NVDA Trend Score ↗

Historical Volatility

Put NVDA’s recent price fluctuations in context when evaluating risk and position size.

Historical NVDA Historical Volatility chart from the Light Data API exampleView NVDA volatility ↗

NEW · INTRADAY SENTIMENT SCORE & INTRADAY MINUTES

Keep up with sentiment shifts. Know what deserves a closer look.

Intraday Sentiment Score shows the sentiment reading and score change for individual S&P 1500 stocks, updated every five minutes during the trading day. Sort by score to find unusually optimistic or pessimistic readings, or by change to identify stocks where sentiment is shifting most sharply.

Get notified when major stocks reach extremes.

You don’t have to watch the dashboard all day. Intraday Minutes automatically emails you when a major stock reaches an extreme sentiment signal that warrants your attention. Follow the email link to the Intraday Minutes page to review the notice, then use sentiment alongside price and trend to assess your next move.

S&P 1500 Intraday Optix · Actual dashboard, November 13, 2026

DATA API, DASHBOARD & AI CONNECTIVITY

Want SentimenTrader
in your own workflow?

Data API subscriptions and API access to analytical tools are not included in this promotional offer. Contact us for access options and pricing.
{ }

01 / DATA API & INTEGRATIONS

Bring SentimenTrader indicators into your workflow.

Access SentimenTrader indicator data through Light Data API and integrate it with your existing tools and applications.

TradingViewTrendSpiderGoogle Sheets Add-onMCP

$300/yearfor 10 indicators

Explore Light Data API
▤

02 / MY DATA API DASHBOARD

Your subscribed indicators. A ready-made dashboard.

View supported indicators from your Data API subscription without building a dashboard yourself. Check the latest readings, explore historical charts and percentile rankings, and see how the S&P 500 performed after similar readings.

Available to Light and Enterprise Data API subscribers.

03 / MCP CONNECTIVITY

Work with your SentimenTrader data through AI.

Connect a compatible AI assistant to the indicator data included in your Data API subscription. Ask questions and explore your subscribed data within your AI environment. Access to additional analytical tools depends on your plan.

Ask about AI connectivity

BEFORE YOU GET STARTED

The Everything Plan
Offer, clearly explained.

Offer ends December 7, 2026,
at 11:59 p.m. New York time.

How do the trial and three months work?

Start with a seven-day free trial. Credit card details are required. Unless you cancel before the trial ends, your subscription continues at $33 per month for the first three paid months. You are billed monthly and can cancel anytime, with no commitment to all three payments. The free trial is additional to the three paid months.

What happens after the three months?

After your first three paid months, your subscription automatically renews at the standard price of $99 per month unless cancelled. You continue to be billed monthly and can cancel anytime.

Who is eligible?

This offer is for customers who have never previously paid for a SentimenTrader subscription. Former paying customers are not eligible for this promotion, but please contact us for your returning-client offer.

Complete trial signup by December 7, 2026, at 11:59 p.m. New York time to retain the offer, even if your trial ends afterward.

What if I cancel?

Cancel before your seven-day free trial ends and you won’t be charged. After the trial, cancellation stops the next monthly renewal. Access continues through your current paid monthly period. You do not have to complete three payments.

Once your subscription ends after cancellation, the promotional rate cannot be resumed. Any returning-customer offer available at that time would apply.

How do I cancel?

In your account, go to My Account → Manage Account → Manage Plan → Cancel Plan. You can also contact admin@sentimentrader.com for help with cancellation. Cancel before the trial ends or your next renewal to stop the next charge.

See the Subscriber Agreement for the full subscription terms.

Are Data API and MCP included?

No. They are available as separate services with separate pricing. Contact us to discuss the access and compatibility you need.

Do I need to use every tool to become a better trader?

No. Focus on the research and tools that fit your trading style and objectives. During your trial, we’ll send you emails with practical guidance to help you get started.

You won’t be on your own. Our client service team is an email away, ready to help you use the tools, integrate them into your routine and make more informed trading decisions. Share your trading style and objectives so we can point you toward relevant resources.

I’m having trouble signing up for this offer. What should I do?

Email admin@sentimentrader.com with a brief description of the issue, and our client service team will help you complete your signup.

PERSPECTIVES FROM OUR CLIENTS

What our clients say.

On Smart Money / Dumb Money Confidence
“…is one of my favorite sentiment indexes…”
Liz Ann SondersChief Investment Strategist
Charles Schwab & Co., Inc.
On the research approach
“SentimenTrader has set the standard for a fact-based approach to investing.”
Simon MaierhoferFinancial newsletter writer
Client prior to 2018
On research quality
“Excellent, balanced research product.”
William SRetired CIO
Client prior to 2018

Selected testimonials published on SentimenTrader.com. Individual experiences vary. These comments do not promise investment outcomes. Titles and affiliations are shown as credited on the source website.

SentimenTrader Analysis over emotion.

For research and informational purposes only. Historical results and backtested performance do not guarantee future results. Investing involves risk, including loss of principal. Examples are dated and are not recommendations to trade.

Offer detailsSubscriber AgreementContact us

Sorry, this content is restricted to SentimenTrader members.

To read this post, please login to your account, sign up for our trading solutions or start a 30-day free trial.
LoginStart your 30-day free trial