
Introducing the SentimenTrader Data API for Google Sheets™

Key points
- The SentimenTrader Data API is now available as a Google Sheets™ add-on, empowering traders, analysts, and investors to pull comprehensive market data and proprietary sentiment indicators seamlessly into their spreadsheets using custom formulas (e.g.,
=STAPI_SENTIMENT). - Users can easily fetch historical and real-time data for specific assets (like AAPL) using the
STAPI_SENTIMENT(ticker, indicator, [date], [days])function to track key metrics such as Optix, Trend Score, and Relative Trend Score. - The add-on also supports querying macro indicators, for example using
=STAPI_INDICATOR("Smart Money Confidence","2026-10-30",21)to retrieve the trajectory of the "Smart Money Confidence" indicator over a specified date range. - Several plug-and-play templates are provided, including an "Indicator Explorer" and a "TCTM Dashboard".
Pull SentimenTrader's data directly into Google Sheets™
The SentimenTrader Data API add-on is a powerful tool designed for traders, analysts, and investors. It allows you to seamlessly connect your Google Sheets™ to SentimenTrader's proprietary database, enabling you to pull comprehensive market data and exclusive sentiment indicators directly into your spreadsheets using custom formulas.
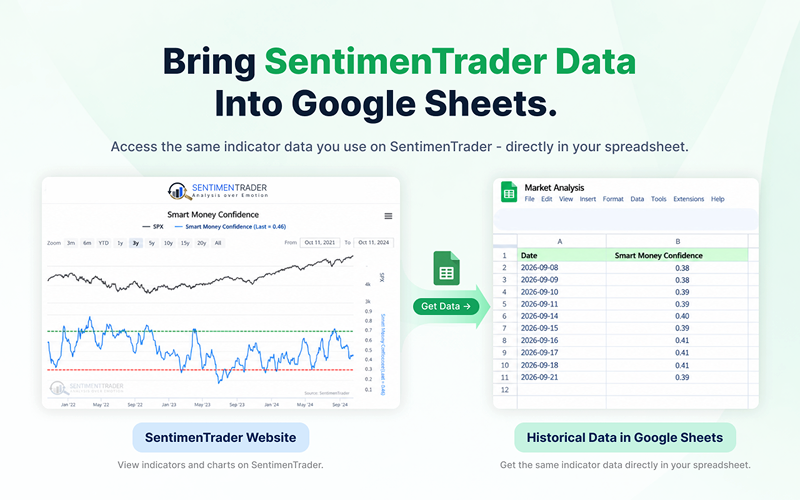
Here, you can use a customized list of stocks and a tailored list of indicators to create your own personalized observation dashboard. At the end of this article, I share two practical templates I have created.
Watch the walkthrough →
Install the Google Sheets™ Add-on →
How should I use this?
Step 1: Install the add-on and open a Google Sheet™
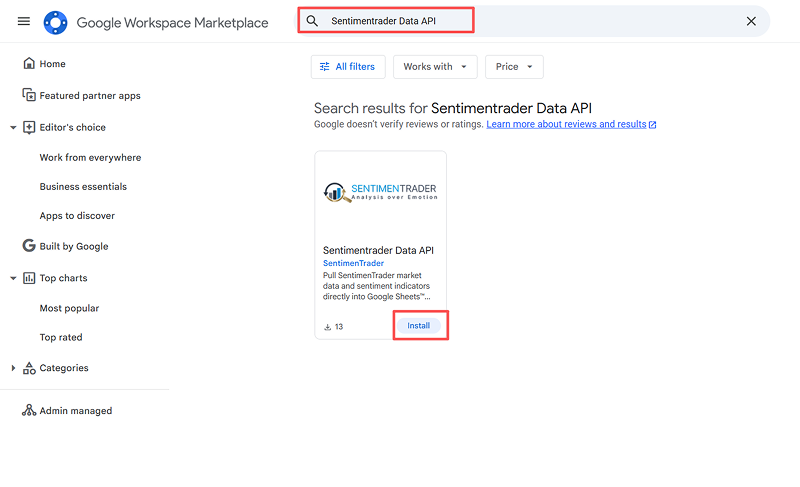
You can search for the Sentimentrader Data API in the Google Workspace Marketplace and download it.
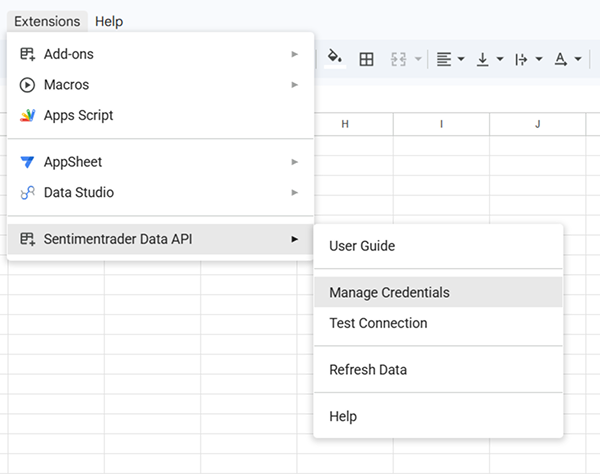
Step 2: Click "Extensions" > "SentimenTrader Data API" > "Manage Credentials" and enter your SentimenTrader Data API username and password.
Step 3: Start fetching data by typing functions directly into any cell
For example, I have a portfolio covering technology and semiconductor stocks that I favor. I want to monitor their status frequently to facilitate trading decisions.
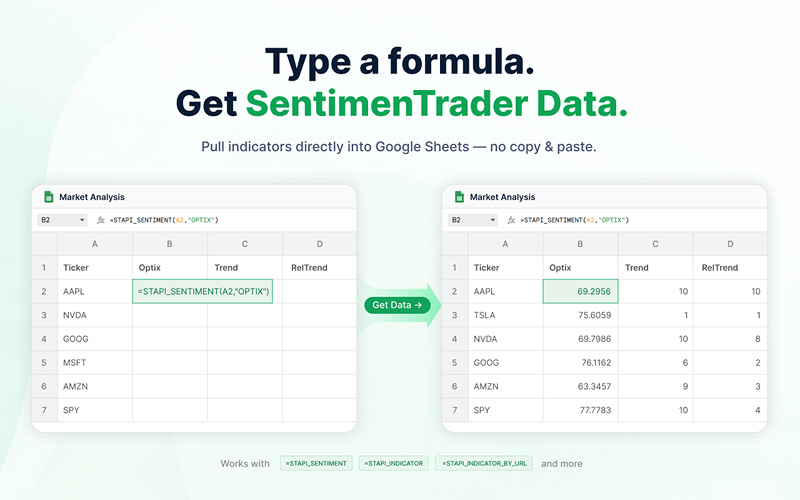
I simply enter a custom function, such as =STAPI_SENTIMENT(A2, "Optix"), to retrieve the optix value for the corresponding stock in cell A2. The same applies to Trend Score and Relative Trend Score; you can easily fetch them using =STAPI_SENTIMENT(A2, "Trend") and =STAPI_SENTIMENT(A2, "RelTrend").
For more advanced usage methods, you can Click "Extensions" > "SentimenTrader Data API" > "User Guide" to view detailed instructions.
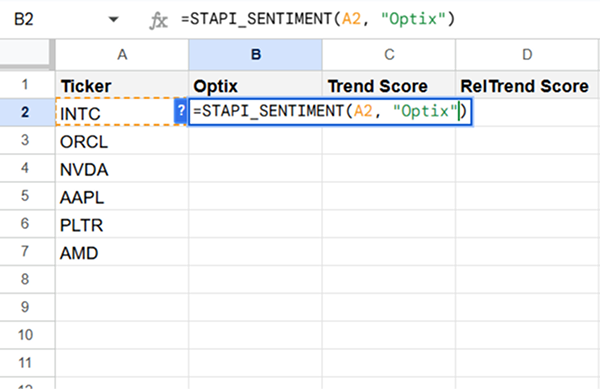
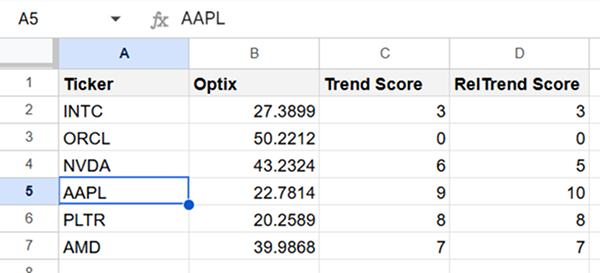
Drag the formula down to automatically fill the cells below, allowing you to fetch indicator data for other Tickers in bulk. Regarding my portfolio, AAPL currently boasts a very healthy Trend Score and RelTrend Score.
For AAPL, I want to use =STAPI_SENTIMENT(A5, "Optix", ,21) to focus closely on its recent Optix trend. This will display its data for the last 21 bars (trading days). As can be seen, its Optix value is still in a downtrend. Perhaps we should wait patiently for it to stabilize and show a reversal signal before considering an entry.
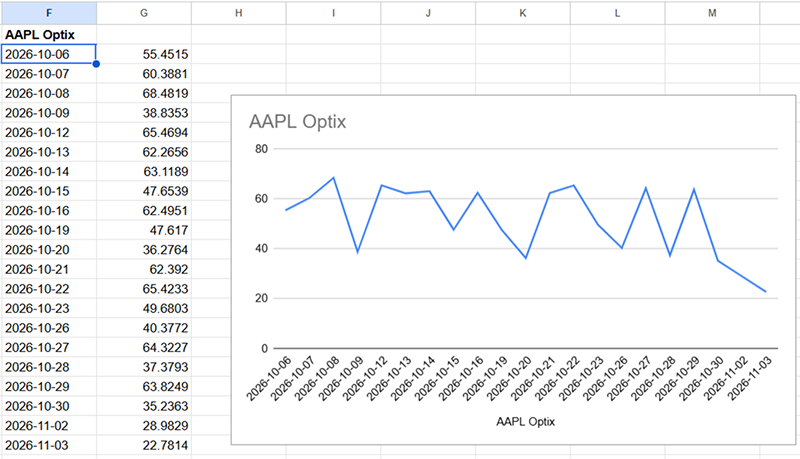
For the STAPI_SENTIMENT(ticker, indicator, [date], [days]) function, the third and fourth positions represent the starting Date and the number of days to return, respectively.
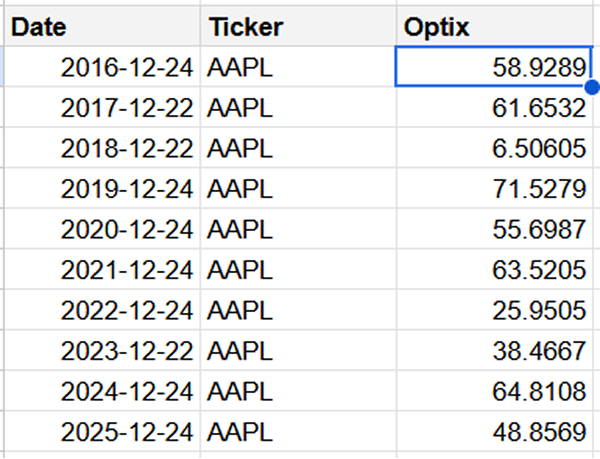
When I want to view the historical optix for AAPL on the day before Christmas, I can enter the formula like this: =STAPI_SENTIMENT(B13, "Optix", A13). Here, cells B13 and A13 represent AAPL and 12/24/2016, respectively.
If you want to retrieve specific macro indicator data, such as Smart Money Confidence, use STAPI_INDICATOR("Smart Money Confidence","2026-10-30",21), which fetches data for the 21 bars prior to October 30.
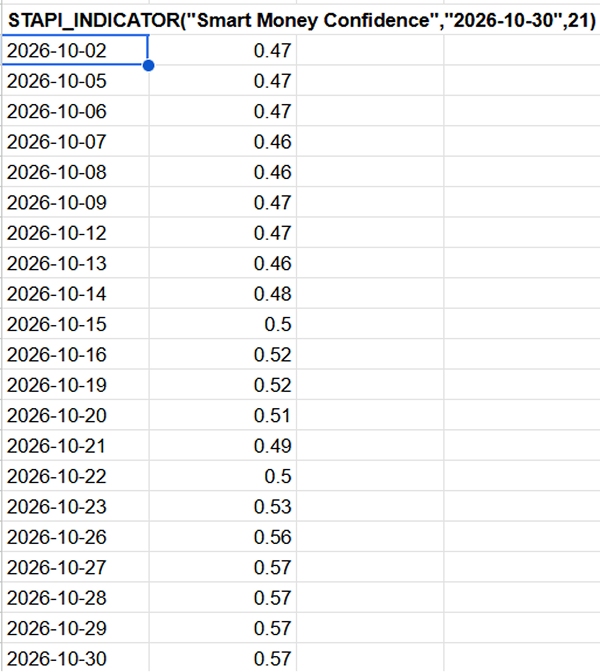
Unsure which indicators are currently available? Using STAPI_INDICATOR_ALL() will list information for all available indicators. For users with the light data API, STAPI_MY_INDICATORS() will list the indicators the current user is subscribed to.
Here are some templates prepared for you
Through our Sentimentrader Data API Google Sheets™ add-on, you can flexibly customize the required plug-in modules and draw visualizations directly within Google Sheets™.
Below are two templates we have meticulously crafted for your reference. Of course, before using them formally, please ensure you have subscribed to our Data API and possess the corresponding permissions to call these indicators.
Indicator Explorer
Simply enter the indicator name in the blue box to display its trend over a recent period with one click.
The background S&P 500 data is powered by Google Finance.
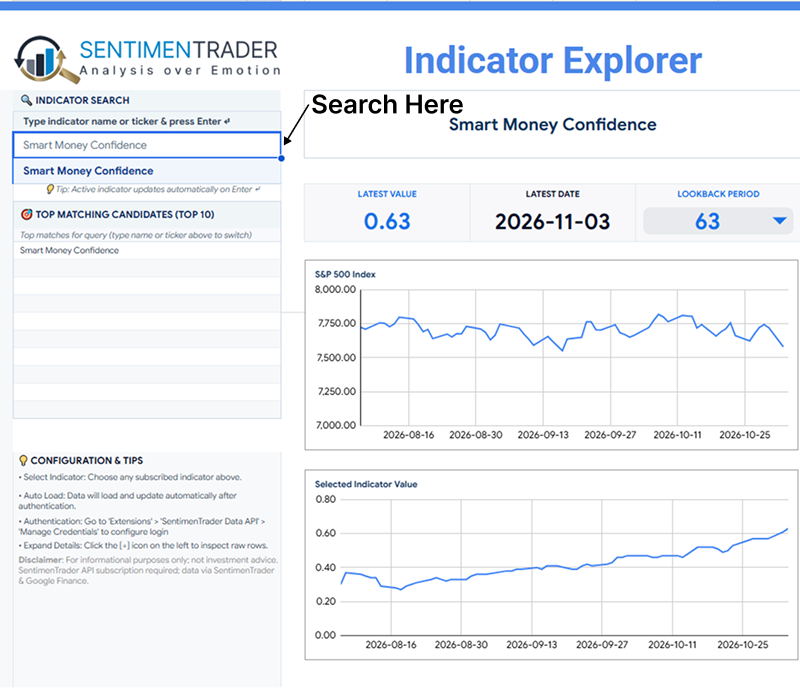
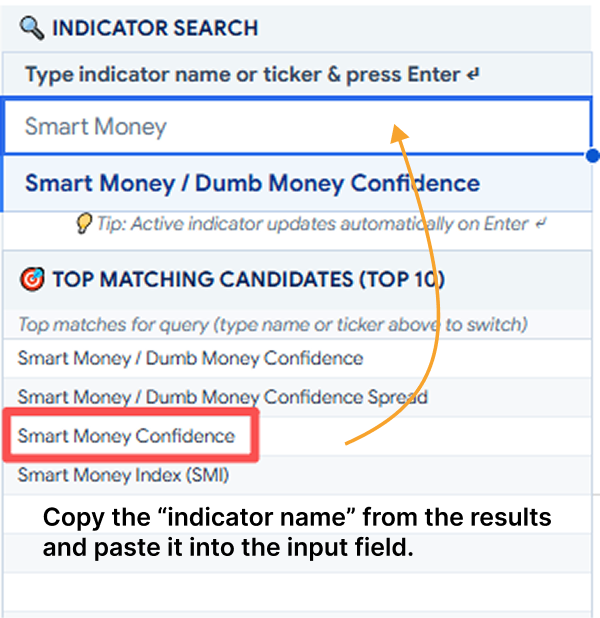
If you don't know the exact full name of the indicator, the selection box also supports fuzzy search. Just copy and paste the final search result into the input box to invoke it.
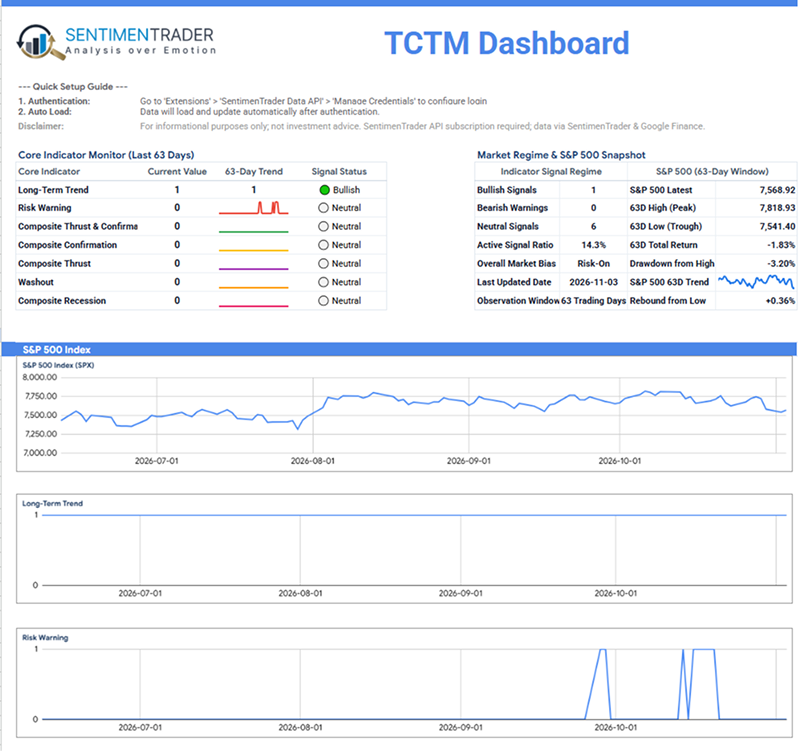
TCTM Dashboard (Tactical Composite Trend Model)
The Tactical Composite Trend Model (TCTM) is the culmination of decades of professional trading experience and quantitative research in financial markets. This model is designed to provide traders and investors with highly valuable signals regarding identifiable key market turning points. With Sentimentrader's Google Sheets™ add-on, you can easily customize your own exclusive TCTM tracking dashboard.
What the research tells us...
The SentimenTrader Data API for Google Sheets™ bridges the gap between our proprietary sentiment indicators and customizable spreadsheet dashboards. Leverage our data feeds to build your own automated trading models, charts, and bespoke dashboards.